An object vibrates. Its vibration releases energy. This energy transforms the air while travelling. Behold: sound! Sound is the longitudinal wave that travels through the air after that vibration. This means that the waves that such object produces travel in the same parallel direction as the particles of air that are being affected by it.
An example of a longitudinal wave:
 |
| Via physics classroom |
But being a display of energy in air, sound is not perceptible by our eyes. However, humans have felt compelled to represent these sounds through their must trusted sense. Arguably the most important innovation in music representation is the staff:

And the staff was a magnificent idea because it helped people to "record" their musical creations. However, it was not a precise way to represent sound visually. In reality, the staff is not necessarily a visual representation of sound, but an extended symbolic language that coded and decoded the pitch an instrument was supposed to make. First, the staff is only useful to represent music; and secondly, it is useless without the written language, because it doesn't allow us to pinpoint the instrument making the sound, the amplitude of the note, or the tempo of the "recording" without words.
The representation of a staff consists of x=time and y=a representation of pitch.
In modern music production the visualization of sound needed to show different elements to capture the complicated process of audio recording. One of the most popular ways to visualize audio this days is through an oscilloscope display. This is how such display would look like:

The oscilloscope display is arguably the most common display in a music studio, because it allows an easy interaction between the producer and the soundwave. It allows you to move easy and fast through an audio track, and locate any part that needs to be located.
The representation consists of x=time, and y=amplitude. Time in music can be measured by seconds, beats, or other methods. The amplitude, which is a measurement that determines loudness, is represented in full-scale decibels. It's common to see the sound wave with a similar second audio channel right under it. This shows that it's a stereo recording, the top being usually the left side and the bottom the right side of the sound.
As practical as the oscilloscope display is, it is really a very simple representation of sound, for it doesn't provide you with an idea of the frequency of the sound. Frequency is an indicator of the pitch of a sound, and it shows a measurement of the amount of times a sound wave vibrates in a determined period of time. To see it in an oscilloscope, you would have to zoom in (a lot) and count the amount of waves that a given track produces in a set amount of time. Well, that's just ridiculous. Just as an infomercial, there has to be a better way!
 |
| wikipedia |
The Spectrum analyzer shows the range of the frequency of a sound (a spectrum, duh!). Each component of a sound, each part of its frequency, is decomposed in the spectrum to show the different rates in hertz of said sound. A hertz is the measurement unit for frequency. 1 vibration per second=1 hertz. In the graphic above, a Spectrum analyzer is shown compared to an oscilloscope. They are very different, because their horizontal representation shows different elements. The spectrum analysis is actually showing the frequency of the sound, the spectrum of elements that forms it, and it can help us to study the timbre of a particular sound.
The Spectrum analyzer shows y=amplitude (in decibels) and x=frequency (in hertz).
One of the most complete representations of sound is the Spectrogram analysis. It resembles an Spectrum analyzer, but laying down. The main difference: it also shows us time. And this difference is huge, because the Spectrogram can show as the variations of frequency of a sound and the ways it changes during the entirety of its signal.
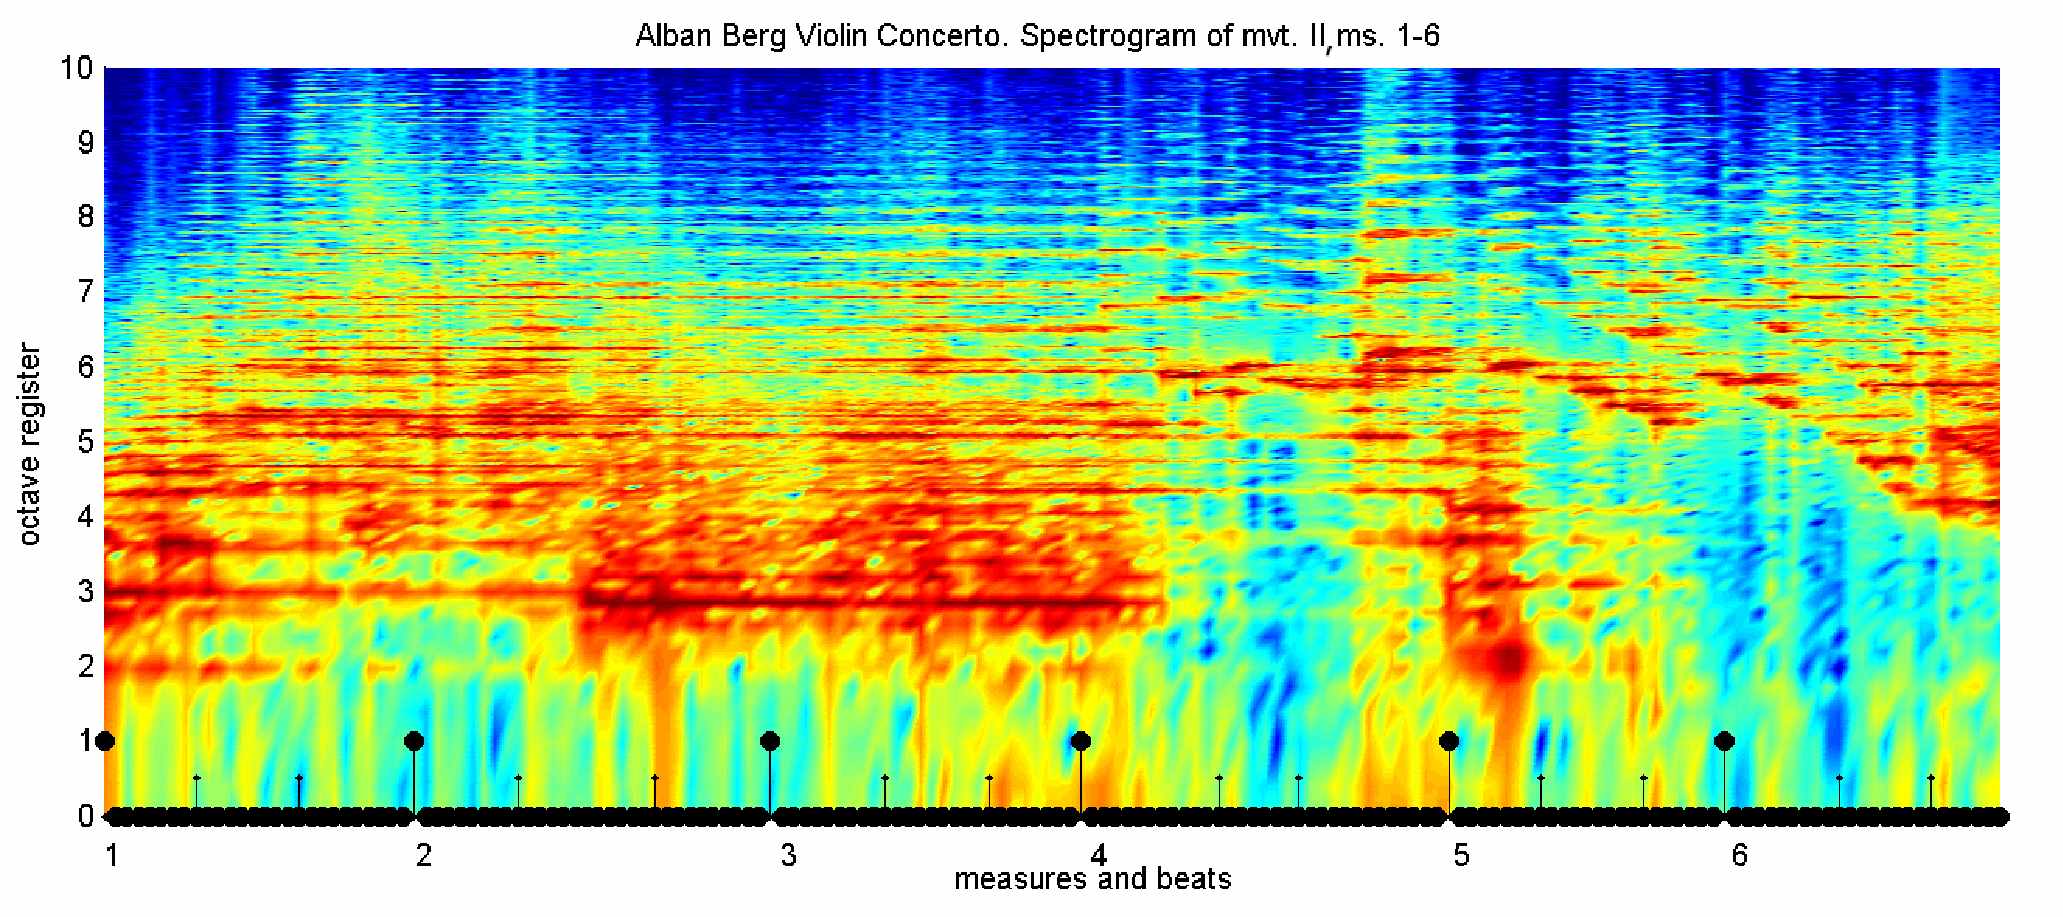 |
| U of Wisconsin |
In this visualization, x=time, either in seconds or beats, y=frequency, the timbre of the sound and how it changes through time, and z=amplitude. In this case, z is the color of the signal.
The Spectrogram analysis is a very important tool for the study of sound, and it is not used only by musicians or producers, but also by anyone interested in the properties of sound. Physicists may conduct experiments on the properties of the frequencies; linguists may study the difference between syllables zoologists can compare different sounds made by animals.
As I said before, the oscilloscope display is probably the most common way to visualize music in the context of music production. But as you progress in your development as producer, you may find the need or the curiosity to explore the way frequency of a sound is displayed. Sooner or later you'll find yourself using either the Spectrum analyzer or the Spectrogram display.
Visualization of sound through a Spectrogram display is an interesting experience, because it really gives you a visual sense of the sound properties. It has become so popular that some artists have created pictures with their sounds. Like Aphex Twin, in a song people just call "equation" because its name is a long... um... equation.
 |
| Aphex Twin's "equation" through a Spectrogram display |
Also, check out below Venetian Snares track "Look", on their aptly named album Songs about my Cats. Notice the difference of visualization between a Spectrogram analysis, the main composition of the video, and the tiny oscilloscope display that is shown at the bottom of the video.
Thanks for reading!
E.
No comments:
Post a Comment